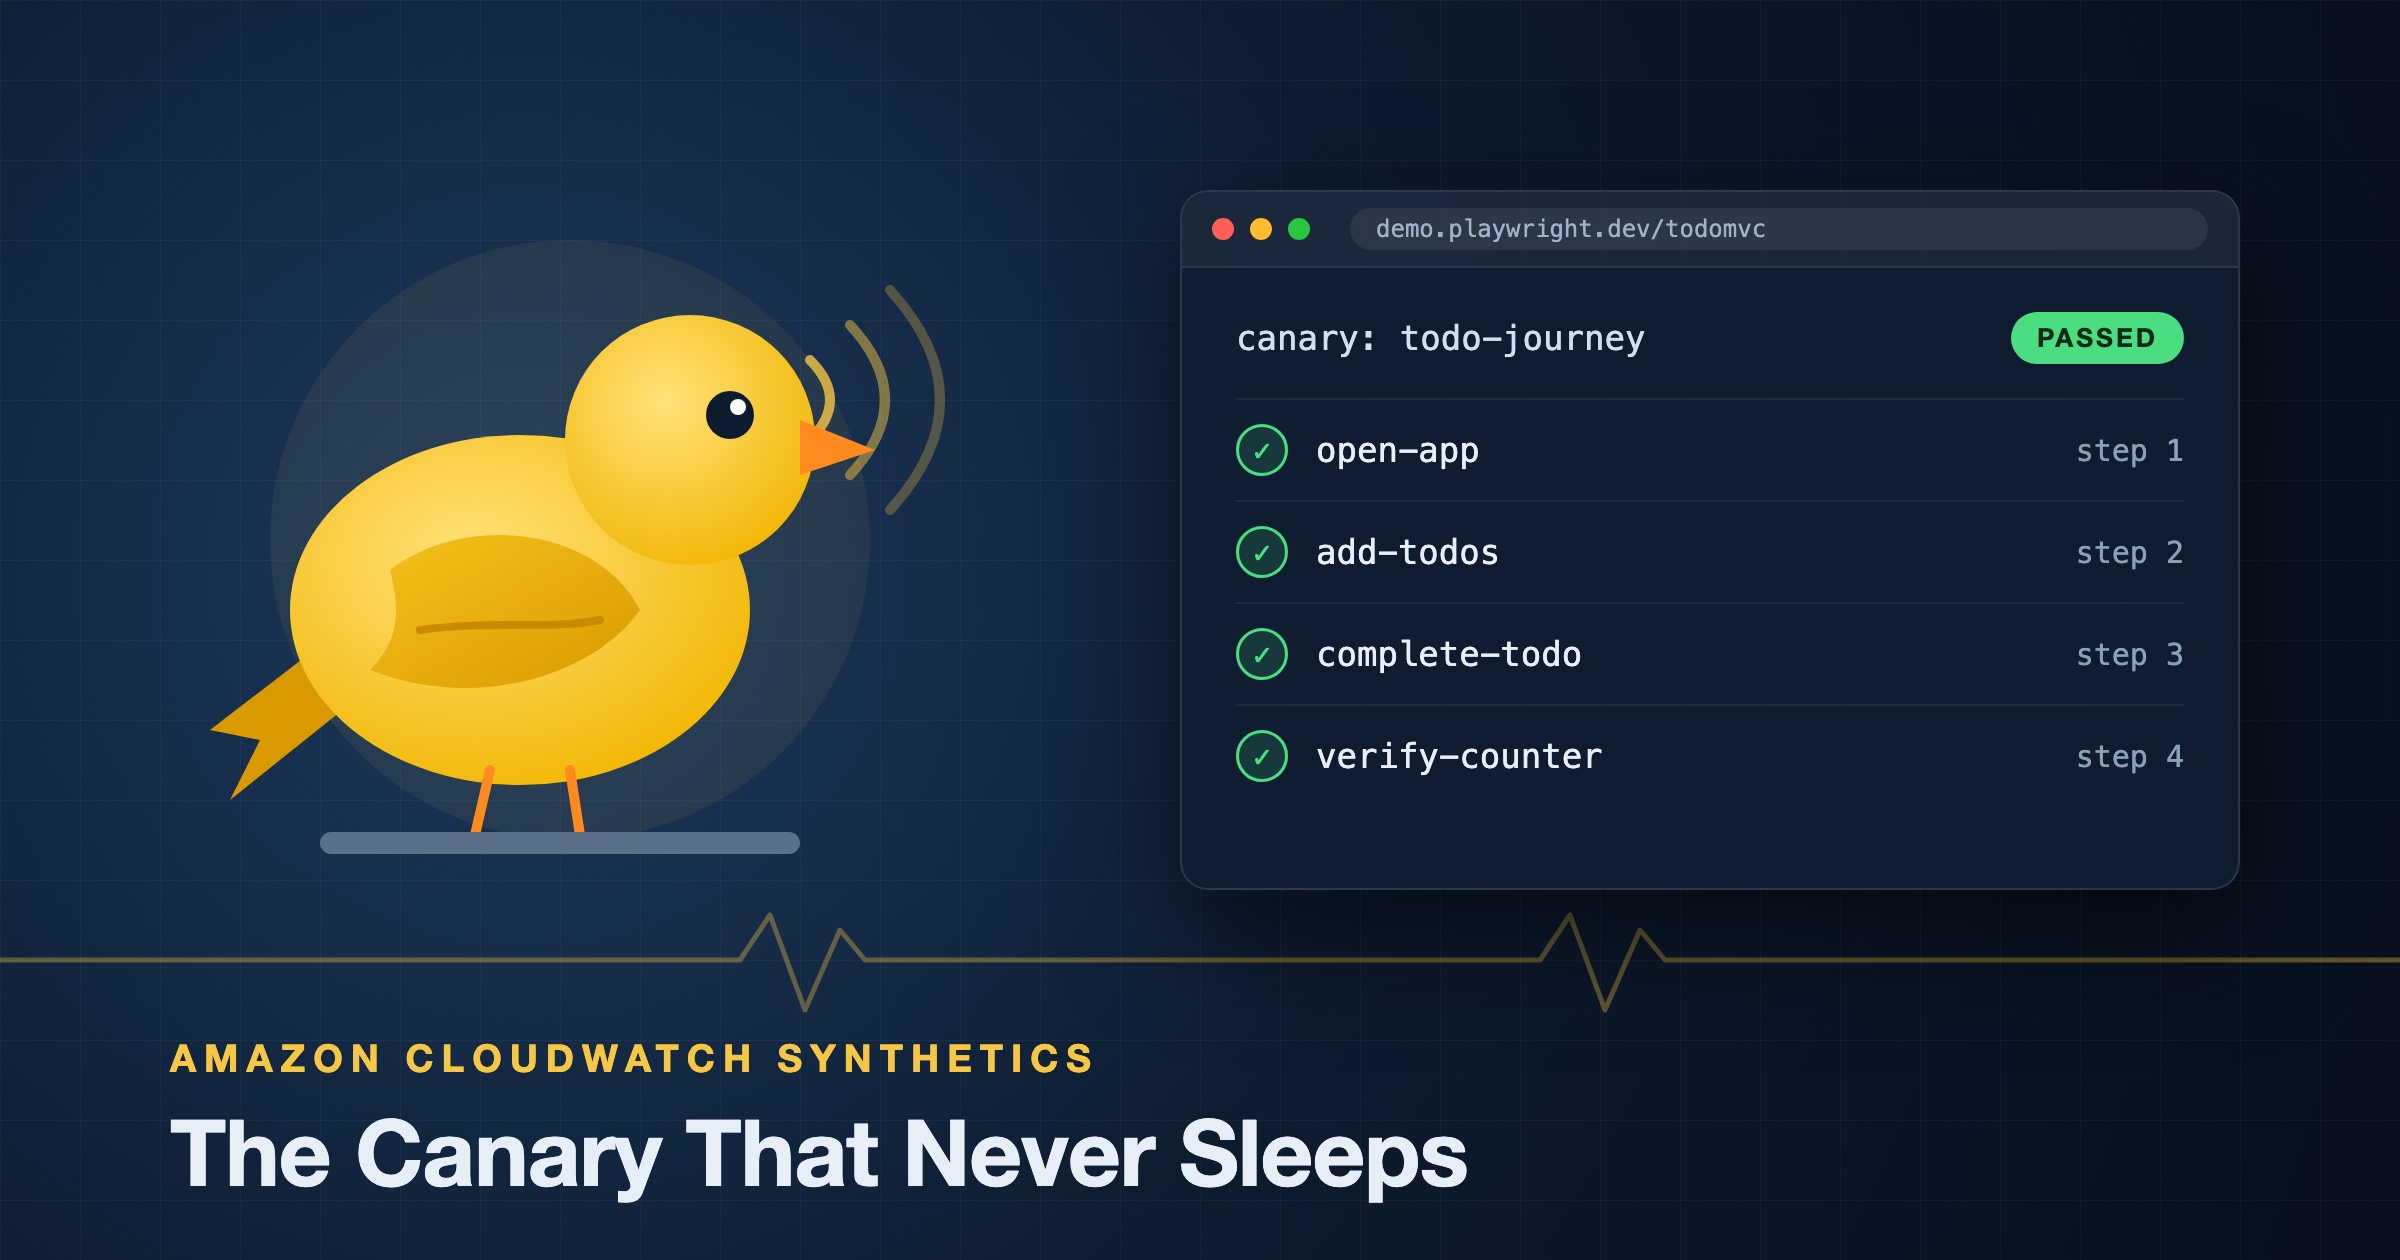
For most of the twentieth century, British coal miners took a small yellow bird to work with them. Canaries react to carbon monoxide much faster than people do, so a bird that stopped singing gave miners time to get out before the gas reached them. The practice lasted until 1986, when the British government decided to phase the birds out in favour of electronic detectors (Smithsonian).
The canaries are retired. The idea behind them isn’t. Send something small and expendable ahead of the people you care about, and watch what happens to it. That’s exactly what a CloudWatch Synthetics canary does for your application. It just sings in JSON.
Here’s a scenario you have probably lived through, or will.
It’s Saturday morning. Your CPU graphs are flat and healthy. Lambda error rates are zero. The load balancer reports every target as healthy. Your on-call engineer is asleep, because nothing has paged them.
Meanwhile, nobody has been able to log in since 3 a.m.
A front-end deploy on Friday evening shipped a JavaScript bundle that throws an error on the login page, but only after the page loads. The server returned 200 OK for every request. As far as your infrastructure is concerned, everything went perfectly. You find out on Monday, from a support ticket that starts with “Is anyone there?”
This isn’t a failure of monitoring. Every metric you collected was accurate. The problem is what you were measuring.
| What you monitor | What it tells you | What it misses |
|---|---|---|
| CPU, memory, disk | Your servers are alive | Whether anything useful is happening on them |
| Error rates and logs | Your code reported a failure | Failures your code never noticed: broken JavaScript, a missing button, a third-party script that hangs |
| Load balancer health checks | One endpoint returns 200 |
Whether a user can get from the home page to “Order confirmed” |
| Real user monitoring | What real users experienced | Anything at 3 a.m. when there are no users, and anything before the first user hits it |
All four rows describe your system from the inside. They depend on traffic, and on your code knowing it failed. What’s missing is a view from the outside: something that behaves like a customer, on a schedule, whether or not any real customers are around.
That’s synthetic monitoring. “Synthetic” because the traffic is fake. It’s a script pretending to be a user, and that’s the point.
AWS describes canaries as “configurable scripts that run on a schedule, to monitor your endpoints and APIs” that “follow the same routes and perform the same actions as a customer” (AWS docs).
Underneath, there’s less magic than the name suggests:
cwsyn- prefix, and its logs land in /aws/lambda/cwsyn-<canary-name>-*.rate() or cron() expressions. You can also run a canary once on demand.CloudWatchSynthetics namespace, which you can alarm on like any other metric.That last pair is what turns a script into a monitoring tool. A failing canary doesn’t just tell you that the login page broke. It shows you a screenshot of the broken page, the network waterfall that led up to it, and the log line where the script gave up.
At the time of writing, the latest runtime in each browser family is (runtime versions):
| Runtime | Language | Framework | Browsers |
|---|---|---|---|
syn-nodejs-playwright-9.0 |
Node.js 22.x | Playwright 1.63.0 | Chromium, Firefox |
syn-nodejs-puppeteer-18.0 |
Node.js 22.x | puppeteer-core 25.11.0 | Chromium, Firefox |
syn-python-selenium-13.0 |
Python 3.12 | Selenium 4.32.0 | Chromium |
AWS recommends always using the most recent runtime, and it deprecates old ones regularly. If you already write Playwright end-to-end tests, the Playwright runtime will feel familiar, and it’s what we’ll use in the tutorial. Just know that it doesn’t support some of the console blueprints (more on that next).
If you create a canary in the console, you don’t have to start from a blank file. There are seven blueprints (AWS docs):
| Blueprint | What it does | Playwright support |
|---|---|---|
| Heartbeat monitoring | Loads one or more URLs, stores a screenshot and a HAR file | Yes |
| API canary | Tests the read and write functions of a REST API, with multi-step HTTP calls | No |
| Broken link checker | Collects the links on a page and checks them for 404s, timeouts, bad hosts and more | No |
| Visual monitoring | Compares screenshots against a baseline run and fails if they differ beyond a threshold | No (Puppeteer only) |
| Canary recorder | A Chrome extension that records your clicks and typing and generates a script | No |
| GUI workflow builder | Builds a UI flow from actions like Click, Input text and Verify text | Yes |
| Multi checks | Up to 10 HTTP, DNS, SSL and TCP checks from a JSON config, with auth via Secrets Manager | Yes |
The blueprints are a great way to get a heartbeat up in five minutes. For anything you plan to keep, you’ll want the script in version control and the canary in infrastructure as code. So let’s do that.
We’ll monitor a real, public web app: the TodoMVC demo that the Playwright team hosts for exactly this kind of testing. It’s a small app, but it has a proper user journey, and that’s what we care about:
Notice what this catches that a health check never could. If the JavaScript bundle fails to load, step 2 fails. If a CSS change hides the checkbox, step 3 fails. If someone breaks the counter logic, step 4 fails. In every case the server would still happily return 200.
We’ll run the journey every five minutes, alarm when it fails, and send an email when the alarm fires.
npm install -g aws-cdk)cdk bootstrap)mkdir todo-canary && cd todo-canary
cdk init app --language typescript
mkdir canary
The canary folder holds the script that Synthetics will run. Everything else is the CDK app that deploys it.
Create canary/todo.mjs. The structure follows the multi-step Playwright sample from the AWS canary samples: launch a browser through the synthetics helper, wrap each part of the journey in executeStep, and always close the browser at the end.
import { synthetics } from '@aws/synthetics-playwright';

const APP_URL = 'https://demo.playwright.dev/todomvc/';

export async function handler(event, context) {
  try {
    const browser = await synthetics.launch();
    const browserContext = await browser.newContext();
    const page = await synthetics.getPage(browserContext);

    // Step 1: the app loads at all
    await synthetics.executeStep('open-app', async () => {
      await page.goto(APP_URL, { waitUntil: 'load' });
    });

    // Step 2: a user can add todos
    await synthetics.executeStep('add-todos', async () => {
      const input = page.getByPlaceholder('What needs to be done?');
      await input.fill('Feed the canary');
      await input.press('Enter');
      await input.fill('Check the alarms');
      await input.press('Enter');

      const count = await page.getByTestId('todo-item').count();
      if (count !== 2) {
        throw new Error(`Expected 2 todos, found ${count}`);
      }
    });

    // Step 3: a user can complete a todo
    await synthetics.executeStep('complete-todo', async () => {
      await page
        .getByTestId('todo-item')
        .first()
        .getByRole('checkbox', { name: 'Toggle Todo' })
        .check();
    });

    // Step 4: the app shows the right state back
    await synthetics.executeStep('verify-counter', async () => {
      const counter = (await page.getByTestId('todo-count').innerText()).trim();
      if (counter !== '1 item left') {
        throw new Error(`Expected "1 item left", got "${counter}"`);
      }
    });
  } finally {
    await synthetics.close();
  }
}
A few details worth calling out:
handler. Synthetics looks it up by name, and the handler string you give CDK is <filename>.handler, so this one is todo.handler..mjs extension makes this an ES module, which is why import works without a package.json. The Playwright runtime accepts .js, .mjs and .cjs files (CDK docs).@aws/synthetics-playwright. Older blog posts use @amzn/synthetics-playwright. AWS moved to the new namespace in syn-nodejs-playwright-5.1, and the old one is scheduled for deprecation.SuccessPercent and Duration metrics with a StepName dimension. When the canary fails, you’ll know which part of the journey broke without opening a single log.I picked the selectors by looking at the live app: the input’s placeholder is What needs to be done?, each todo is a data-testid="todo-item", the checkbox has the accessible name Toggle Todo, and the counter is data-testid="todo-count". Prefer selectors like these, test IDs and accessible roles, over CSS classes. They change far less often, and a canary that fails because someone renamed a class is a canary people learn to ignore.
Replace the contents of lib/todo-canary-stack.ts:
import * as path from 'path';
import { Duration, Stack, StackProps } from 'aws-cdk-lib';
import { Construct } from 'constructs';
import * as synthetics from 'aws-cdk-lib/aws-synthetics';
import * as cloudwatch from 'aws-cdk-lib/aws-cloudwatch';
import * as actions from 'aws-cdk-lib/aws-cloudwatch-actions';
import * as sns from 'aws-cdk-lib/aws-sns';
import * as subscriptions from 'aws-cdk-lib/aws-sns-subscriptions';

export class TodoCanaryStack extends Stack {
  constructor(scope: Construct, id: string, props?: StackProps) {
    super(scope, id, props);

    const canary = new synthetics.Canary(this, 'TodoJourney', {
      canaryName: 'todo-journey',
      runtime: new synthetics.Runtime(
        'syn-nodejs-playwright-9.0',
        synthetics.RuntimeFamily.NODEJS
      ),
      test: synthetics.Test.custom({
        code: synthetics.Code.fromAsset(path.join(__dirname, '..', 'canary')),
        handler: 'todo.handler',
      }),
      schedule: synthetics.Schedule.rate(Duration.minutes(5)),
      timeout: Duration.minutes(1),
      maxRetries: 1,
      provisionedResourceCleanup: true,
    });

    const topic = new sns.Topic(this, 'CanaryAlerts');
    topic.addSubscription(
      new subscriptions.EmailSubscription('you@example.com')
    );

    const alarm = new cloudwatch.Alarm(this, 'TodoJourneyFailing', {
      metric: canary.metricSuccessPercent({ period: Duration.minutes(5) }),
      evaluationPeriods: 2,
      threshold: 90,
      comparisonOperator: cloudwatch.ComparisonOperator.LESS_THAN_THRESHOLD,
      treatMissingData: cloudwatch.TreatMissingData.BREACHING,
      alarmDescription: 'Users may not be able to add or complete todos',
    });
    alarm.addAlarmAction(new actions.SnsAction(topic));
  }
}
Replace you@example.com with your own address. Here’s what each piece is doing:
new synthetics.Runtime(...) instead of a constant. CDK ships constants like Runtime.SYNTHETICS_NODEJS_PLAYWRIGHT_6_0, but they lag behind what AWS releases. When I checked, the newest Playwright constant in the CDK docs was 6.0 while the service was already on 9.0. The Runtime constructor takes any version name and a RuntimeFamily, so you’re never stuck waiting for a CDK release.schedule: every five minutes. Schedule.rate accepts anything from one minute up to an hour, and there’s also Schedule.cron(...) and Schedule.once().timeout: how long a single run may take. It can’t be longer than the schedule interval, and it caps out at 14 minutes. Don’t go below 15 seconds, because the Lambda cold start and browser launch need that much on their own (AWS docs).maxRetries: 1: if a scheduled run fails, Synthetics automatically makes one more attempt. Valid values are 0 to 2 (auto-retry docs). More on why this matters below.provisionedResourceCleanup: true: deletes the underlying Lambda function and layers when you delete the canary, instead of leaving them behind.treatMissingData: BREACHING is the line most people forget. If the canary itself stops running (a bad deploy, a deleted role, an expired runtime), it stops publishing metrics. With the default setting, the alarm just sits in INSUFFICIENT_DATA and says nothing. A silent canary is precisely what you need to hear about, so treat silence as failure.You didn’t have to create an S3 bucket or an IAM role. The Canary construct creates an artifacts bucket and an execution role for you. If you bring your own role, it needs a trust policy for lambda.amazonaws.com and permissions for s3:PutObject, s3:GetBucketLocation, s3:ListAllMyBuckets, cloudwatch:PutMetricData and the CloudWatch Logs actions (required permissions).
npx cdk deploy
Two things happen after it finishes:
todo-journey. Within a few minutes the first run shows up.Click into a run and you’ll see the four steps with a status and duration for each, the screenshots, the HAR file and the logs. This page is the best part of Synthetics, so take a look around while it’s green and boring.
A monitor you’ve never seen fail is a monitor you don’t trust yet. So let’s break the “app”.
We can’t break the TodoMVC demo, but we can change what we expect from it. In canary/todo.mjs, change the expected counter text:
if (counter !== '2 items left') {
Deploy again with npx cdk deploy and wait. Here’s what you should see:
verify-counter step, while open-app, add-todos and complete-todo still pass. The step metrics tell you exactly where the journey broke.Expected "2 items left", got "1 item left".maxRetries: 1, Synthetics makes one extra attempt after each failed scheduled run. This failure is permanent, so the retry fails too, and the RetryCount metric starts climbing.ALARM and the email arrives.Now put the check back to '1 item left' and deploy. The canary goes green and the alarm returns to OK. You’ve just tested your alerting from end to end, which is more than a lot of production systems can say.
npx cdk destroy
Because we set provisionedResourceCleanup, the canary’s Lambda function and layers go with it. Check the S3 console for the artifacts bucket and the CloudWatch Logs console for /aws/lambda/cwsyn-todo-journey-* log groups, and delete anything you don’t want to keep.
The CloudWatch pricing page lists $0.0012 per canary run in its US East examples, with 100 canary runs per month in the free tier. Since you pay per run, the schedule is your main cost lever:
| Schedule | Runs per canary (31-day month) | Canary run charges |
|---|---|---|
| Every hour | 744 | about $0.77 |
| Every 5 minutes (our tutorial) | 8,928 | about $10.59 |
| Every minute | 44,640 | about $53.57 |
The first two rows subtract the 100 free runs. The free tier is per account, so it only applies once no matter how many canaries you have.
That’s only the Synthetics part of the bill. Every run is also a Lambda invocation, writes logs, and puts objects in S3. AWS’s own worked example, five canaries running every five minutes with 20-second runs at 1 GB, adds about $14.89 of Lambda, $3.55 of CloudWatch Logs and $1.25 of S3 per month on top of the run charges. Long runs cost more, so a lean script is also a cheaper script.
Each retry is another Lambda invocation that writes more logs and artifacts, so a flaky canary that retries constantly costs more too. The honest guidance: run your most important journeys every one to five minutes, and everything else every 15 to 60 minutes.
If an alarm fires every Tuesday for no reason, your team learns to ignore it, and then it gets ignored on the day it matters.
Keep it stable:
setTimeout sleeps.maxRetries).Watch the retry metrics. When retries are on, Synthetics also publishes two extra metrics (metrics docs):
| Metric | What it tells you |
|---|---|
RetryCount |
How many times the canary retried |
SuccessPercentWithRetries |
The percentage of runs that succeed after all attempts |
Put both on a dashboard. A rising retry count is an early warning that something is getting slower or less reliable, even while the journey still passes in the end. Once you’ve seen how they behave for your canary, decide which success metric your alarm should use.
A canary that signs up, places an order or sends an email does it every five minutes, forever. So:
If the journey needs to log in, keep the credentials in AWS Secrets Manager and fetch them at runtime. The Multi checks blueprint does this for you, with Basic, API key, OAuth and SigV4 auth through Secrets Manager.
Canaries can run inside your VPC to test internal apps. To make that work (VPC docs):
com.amazonaws.<region>.monitoring plus an S3 gateway endpoint.ec2:CreateNetworkInterface, ec2:DescribeNetworkInterfaces, ec2:DeleteNetworkInterface) to the execution role.AWS regularly deprecates old runtime versions.
| Setting | Default | Tip |
|---|---|---|
| Artifact retention | 31 days for both successful and failed runs | Tune successRetentionPeriod and failureRetentionPeriod separately. Keeping failures longer than successes is a sensible default |
| Your own artifacts bucket | n/a | The bucket name can’t contain a period (.) |
CloudWatch also has Real User Monitoring (RUM), which collects performance and error data from real users’ browsers. They answer different questions:
RUM can only tell you something broke after real people have hit it. A canary can tell you before they do. Mature teams use both: canaries as the smoke detector, RUM as the full picture.
rate(1 minute) to rate(1 hour), and cron expressions cover everything else.Location dimension per Region, plus an aggregate SuccessPercent. This needs syn-nodejs-puppeteer-16.0 or syn-nodejs-playwright-7.0 or later. It isn’t available in GovCloud or China, and each replica costs the same as a standalone canary (multilocation docs).handler, use synthetics.launch() and executeStep, and swap test-runner assertions for checks that throw.activeTracing: true in CDK) and the run’s requests show up in your traces. AWS documents it for syn-nodejs-2.0 and later runtimes, but not for Firefox canaries. It adds 2.5% to 7% to run time, and traces have their own charges (tracing docs).executeStep calls so you get per-step metrics and know exactly where it broke.SuccessPercent, set treatMissingData to breaching so a dead canary pages you, and use retries to keep flakiness out of your pager.new synthetics.Runtime('<version>', RuntimeFamily.NODEJS) so you’re not stuck on whatever runtime constants your CDK version knows about.The miners didn’t keep a canary because they expected gas every day. They kept one because the day it mattered, they wanted to know before anyone got hurt. Your canary will spend most of its life passing, quietly, every five minutes. That’s not wasted money. That’s the sound of it singing.